After a half-century of protections under the U.S. Clean Air Act, Americans have seen steady improvements in air quality.
The federal Clean Air Act became law in 1970, and since then the combined emissions of criteria and precursor pollutants have dropped by 78 percent nationwide.
NOTE: The Washington State Clean Air Act was established in 1967 and ORCAA was established in March 1968 – a full two years before the federal law was enacted.
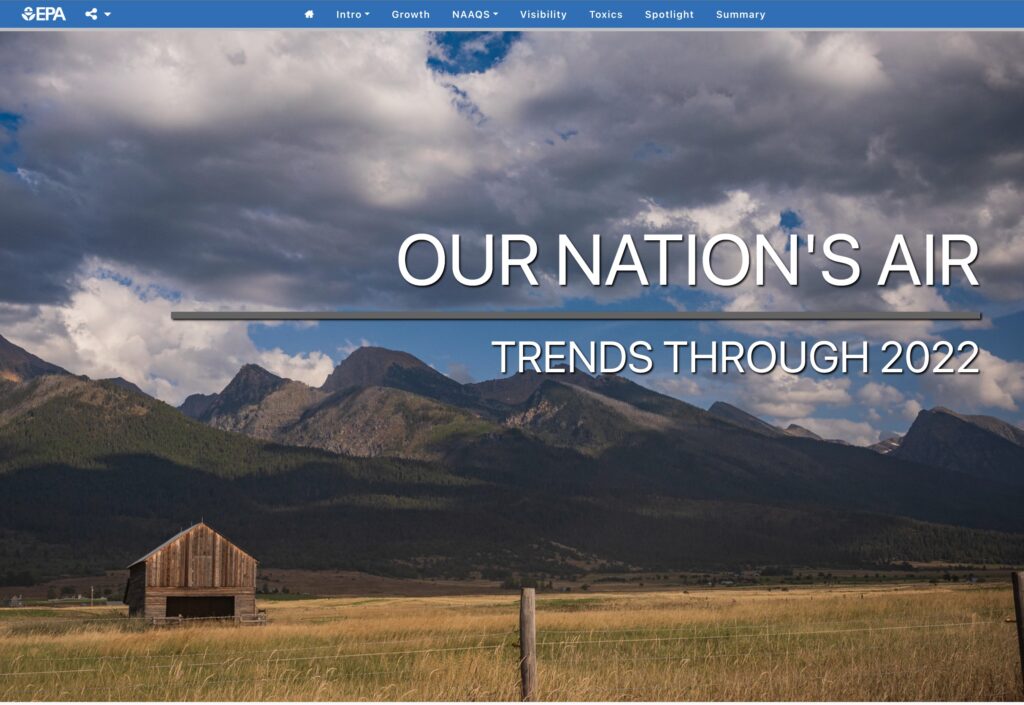
The U.S. Environmental Protection Agency (EPA) recently published a report outlining the impacts of the federal law.
The online report features summary descriptions of programs as well as easy-to-use tools to delve deeper into the data and explore the full impacts of clean air protections around the country. Whether looking for information on past trends in Particulate Matter (PM) pollution and other criteria pollutants or exploring ways to stay informed about current and future air quality, the report offers tools to aid you. See link below for the full report.
Our Nation’s Air 2023 (epa.gov)
Report Highlights
The report linked above notes that since 1990, emissions of all measured pollutants have declined:
- Carbon Monoxide (CO) 8-Hour, 81%
- Lead (Pb) 3-Month Average, 88% (from 2010)
- Nitrogen Dioxide (NO2) Annual, 60%
- Nitrogen Dioxide (NO2) 1-Hour, 54%
- Ozone (O3) 8-Hour, 22%
- Particulate Matter 10 microns (PM10) 24-Hour, 34%
- Particulate Matter 2.5 microns (PM2.5) Annual, 42% (from 2000)
- Particulate Matter 2.5 microns (PM2.5) 24-Hour, 42% (from 2000)
- Sulfur Dioxide (SO2) 1-Hour, 90%
- Numerous air toxics have declined with percentages varying by pollutant
Why Air Quality Programs matter
As noted in this report, numerous scientific studies have linked air pollution and specific pollutants to a variety of health problems and environmental impacts. Depending on the pollutant, people at greater risk for experiencing air pollution-related health effects may include older adults, children and those with heart and respiratory diseases — 30-second Healthy Heart video. Clean air laws – both state and federal – have helped reduced illness and save lives.
Monitoring our air quality
ORCAA and other local air agencies around the country work closely with the state programs as well as EPA to maintain a wide network of air quality monitoring stations.
Using this network, as well as the networks of private owned (but publicly shared) personal air monitoring devices (notably, Purple Air devices) EPA and the U.S. Forest Service (USFS) jointly created the Fire and Smoke Map in 2020 to test data layers of particular use during fire and smoke events. While the personal air monitoring sensors do not meet the rigorous standards required for regulatory monitors, they can help you get a picture of air quality nearest you especially when wildfire smoke is in your area.
As part of this effort, EPA developed a correction factor for these air sensors so that they are more consistent with regulatory monitors. Details about this correction factor, along with the latest science on the performance, operation and use of air sensor monitoring systems for technology developers, air quality managers, citizen scientists and the public can be found on EPA’s Air Sensor Toolbox.


