

Ambient Air Quality Analysis
The EPA developed national standards for six air pollutants, referred to as “criteria air pollutants”. These national standards are called national ambient air quality standards (NAAQS). The six criteria pollutants are Carbon Monoxide (CO), Lead (Pb), Nitrogen Dioxide (NO2), Ozone (O3), Particulate Matter (PM10 and PM2.5), and sulfur dioxide (SO2).
In our jurisdiction, PM2.5 is the primary pollutant of concern. Our air quality monitoring network focuses on that.
PM 2.5 — Particulate Matter 2.5-microns and smaller
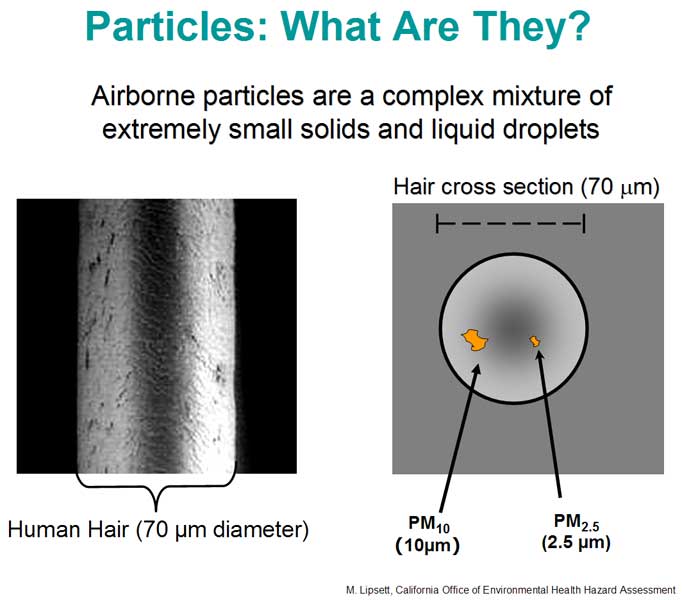
Particles smaller than 2.5 micrometers in diameter, suspended in outdoor air, are called fine particulate matter, or PM2.5. These particles are approximately 1/30th the width of a human hair. Exposure to PM2.5 is linked with respiratory disease, decreased lung function, asthma attacks, heart attacks, and premature death. Children, older adults, and people with respiratory illnesses are especially at risk and should avoid outdoor exertion if PM2.5 levels are high. Certain types of particulate matter are considered air toxics (e.g. exposure to particulate matter from diesel exhaust is associated with an increased risk of cancer).
How we use air data in practice
ORCAA uses air monitoring data along to address areas of concern as well as help in the crafting of permits for businesses and other stationary sources that may impact air quality. In conjunction with state and federal rules, ORCAA’s Rule 6.1.4(a)(3) requires a demonstration that emissions resulting from the project will not cause or contribute to a violation of any Ambient Air Quality Standard (AAQS). More details on permitting issues can be found on our For Businesses pages.
Ultrafine Particle Study Report
Regional Impact of a Biomass-fueled Co-generation Boiler on Ambient PM2.5 and Ultrafine Particle (UFP) Concentration in Port Angeles, Washington.
Dec. 21, 2018
by Odelle Hadley, Lauren Whybrew, Cassandra Gaston, Honglian Gao, Dan Jaffe, and Joel Thornton
Final, Full Report available here (PDF format)
Executive Summary Details
Executive Summary
(Accompanying Presentation Available Here)
In 2012, Nippon Paper Industries (Nippon) filed a permit to construct a biomass co-generation facility in Port Angeles, WA. Nippon proposed replacing a 1950s, mixed hog-fuel and diesel boiler with a new, 20-megawatt, co-generation plant that would provide power to the mill and potentially sell power back to the grid. Residents worried changes in mill emissions, specifically an increase in ultra-fine particles (UFP –particles with diameters measuring less than 0.1 micrometers), would degrade regional air quality and increase health problems in the area. This study focused on evaluating changes in air pollutants (UFP and PM2.5) due to the new biomass co-generation facility. The second goal was to identify sources of ambient PM2.5 (particles with diameters measuring less than 2.5 micrometers) and UFP in the region.
Air quality monitors were installed at the Port Angeles Fire Station (PAFS), 102 E 5th St, Port Angeles, WA. The monitoring site is located about 3 miles southeast of Nippon (slide 3). Data were collected between January 1, 2014 and June 30th, 2015. A table of the instruments and their specific data collection dates are shown on slide 4. Winter and summer data collected in 2014 represent the period before the co-generation boiler was in operation, while the 2015 data were collected afterwards.
PM2.5 and UFP concentrations were highest during the winter months (January and February) relative to summer (May and June) (slides 5 and 6). January and February were the only two winter months in both 2014 and 2015 when data were collected and May and June the only two summer months. Analysis was limited to these four months to ensure seasonal consistency between the 2014 and 2015 data comparison. Average winter PM2.5 levels were 2.5 times greater than average summer values and the maximum hourly values were more than 3 times greater in winter than in summer (slide 5). Average winter UFP concentrations were about 1.5 times higher compared to summer (slide 6). A published study by Gaston et al [2016] definitively showed the winter increase in both PM2.5 and UFP were due to residential heating with woodstoves and fireplaces. Winter UFP concentrations in 2015 exhibited the same daily pattern observed in 2014 (slide 6) but were, on average, 13 percent lower. This may be due to more frequent sub-freezing temperatures and stagnation episodes in 2014 relative to 2015.
Winter winds in Port Angeles blow most frequently from the south and southwest (slide 7). Since Nippon sits northwest of PAFS, air monitors would rarely detect their emissions in the winter. Combined with the overwhelming woodstove emissions, it would have been nearly impossible to determine any wintertime air quality impacts from changes in Nippon’s operation.
In contrast, summer winds are most frequently northwesterly, westerly, and southwesterly providing a much higher probability of detecting Nippon’s emissions during these months. Seasonal wind patterns were consistent in both 2014 and 2015.
Average summer UFP concentrations were approximately 30 percent lower in 2015 compared to the same time in 2014. This remained true when only data corresponding to northwesterly winds were considered (slide 9). The highest summertime UFP concentrations were associated with northwesterly, northerly, and northeasterly winds indicating port activity, industry and possibly traffic as a source of UFP in the region, however winds exhibit a strong daily pattern where winds are northwesterly during the day and southerly to southwesterly at night (slide 11). Higher UFP might be associated with northerly winds, but it’s also possible monitors responded to a general increase in pollution-generating activities during the day relative to night.
Lastly, carbon monoxide (CO) and UFP data collected during times when winds were northwesterly and the co-generation boiler was operating were compared with data collected during northwesterly winds and the boiler was off. Ambient CO concentrations shifted 20 ppb higher during periods of operation, indicating the monitors were detecting the emission plume from the boiler (slide 13). Using the actual CO emission concentration from the in-stack CO monitor, a pollution dispersion model (AERMOD) predicted ambient CO in the range of 3 to 30 ppb when the air monitors intercepted the emission plume (slide 16). The same analysis for UFP showed no change in ambient concentration when the boiler was running versus idle (slide 17). If Nippon emits significant UFP, it is not detectable 3 miles downwind. There appeared to be a 50 to 100 ng m-3 enhancement in black carbon when the boiler was running, but no significant change (~ 1 µg m-3) in PM2.5 concentrations (slide 18).
The UFP summer daily cycle revealed an average nighttime concentration around 1000 particles cm-3, increasing to 3000 particles cm-3 during the day (slide 20). The highest spikes in UFP occurred on Friday afternoons between 5 and 6 PM in both 2014 and 2015. Further investigation revealed the firemen often cooked dinner on the outdoor grill during the summer. The grill sat on a balcony one level down from the inlet and about 50 meters away. Another known activity affecting UFP concentrations was weekly testing of equipment including generators. These data were removed prior to analysis. Previous studies have shown UFP concentrations dissipate quickly and within 300 meters from their source (slide 19). UFP concentrations are most strongly influenced by the closest point sources, vary widely over short distances and change quickly with time. PM2.5 tends to be regionally uniform (2013-2014 Clallam County Saturation Study) and dissipates more slowly.