

Personal Air Quality Monitoring
Until recently, measuring and reporting air quality has been conducted almost solely by government agencies and research groups. Government air monitoring programs follow strict procedures in operating, maintaining, and reporting validated data. Approved air monitors historically have been prohibitively expensive for purchase and use by private citizens. Yet in the last few years, low-cost particle sensors have become publicly available. Cost ranges from $50 – $1000. With proper guidance, these sensors are easy to install and can provide reasonably accurate air quality data. As sensors gain popularity in our region, ORCAA will provide support on the proper installation and maintenance of your sensor and understanding of the data.
Installing your sensor
Depending on your sensor’s power requirements, you will typically install it on the outside of your house near a power outlet. Some sensors incorporate solar panels as power sources, providing more options on location.
Do NOT install your sensor near:
- A chimney
- Dryer vent
- Water heater exhaust
- Gas or air vent
Air from a vent or chimney blowing on your sensor will prevent it from reading the actual air quality outside your home.
Do install your sensor under a roof overhang to help protect the electronics from blowing rain and debris or snow accumulation during extreme weather events.
The U.S. Environmental Protection Agency (EPA) provides additional guidance on siting your personal air quality monitor. You can find that information here.
Understanding the data
The accuracy and precision of sensor models vary. Below are descriptions of different sensors currently available. Some have been evaluated by ORCAA, WA State Dept of Ecology or EPA. Others are new and in the process of evaluation. As new sensors are developed, vetted, and gain in popularity, we will add them here.
EPA Guidance on Personal Sensors
We’ve seen a boom in the availability of affordable personal Air Quality Sensors. Many of these new class of monitoring devices can be effective in reporting localized air quality in real-time. But as with any technical tool, effectiveness and efficiency often comes down to the details of how the device is set-up and deployed. The U.S. Environmental Protection Agency (EPA) provides great overview of operating air quality monitoring devices.
EPA recently updated its guidance document, How to Use Air Sensors. The new publication, Enhanced Air Sensor Guidebook (2022), provides planning support for folks interested in collecting their own air quality measurements.

The Guidebook can help sensor users:
- Learn the basics of air quality, air pollution monitoring, and air sensors
- Plan and conduct an air quality monitoring study
- Select, set up, and use air sensors
- Analyze, interpret, communicate, and act on results
- Understand the basics of air sensor performance
EPA offers more information about air monitoring guidance on the Air Sensor Toolbox webpages.
Sensor Notes: Purple Air
- Requirements: standard 110V outlet accessible from outdoors, wireless network
- Maintenance: cleaning as needed (see below)
- Data: transmitted to the cloud and publicly viewable through PurpleAir map and EPA’s fire.airnow.gov map.
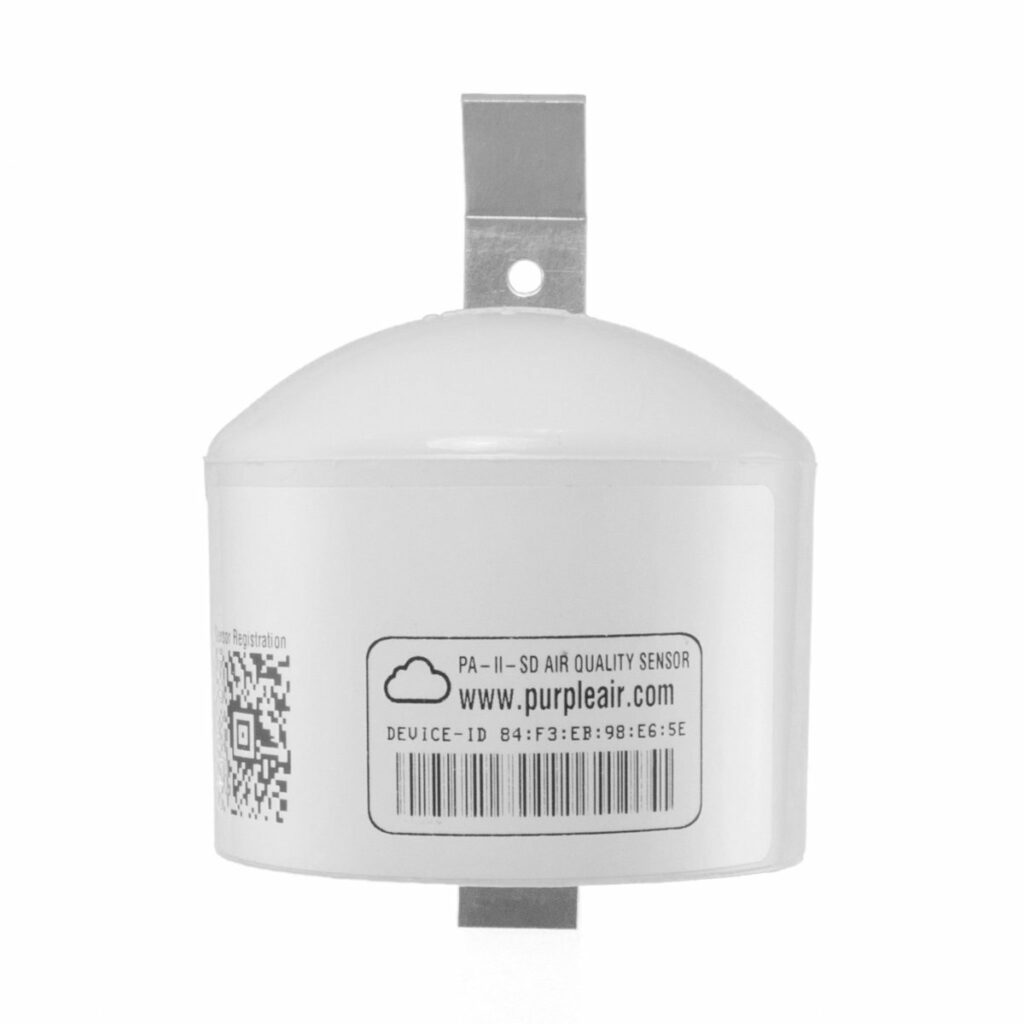
The Purple Air sensor is currently the sensor most used by residents in our region. Several government agencies and academic institutions have completed data quality evaluations. The consensus is: PurpleAir PM2.5 data track extremely well with the federal reference and federal equivalence air monitors, but they consistently overpredict PM2.5 by a factor of 2(+/- 0.5). EPA has developed a correction factor for the PurpleAir sensors. You can apply this correction directly on the PurpleAir map or visit fire.airnow.gov where the correction has been automatically applied. This is a national air quality map developed by EPA, incorporating government-operated PM2.5 monitors (circles), corrected PurpleAir data (squares), and temporary air monitors (triangles). Due to the prevalence of PurpleAir sensors currently in our region, ORCAA will be installing PurpleAir sensors alongside all the county air monitors for public comparison.
PurpleAir sensors are equipped with two sensors and two channels. The average value reported by the two sensors is used on the maps. Clicking on a dot representing a sensor will bring up a recent time series plot of both. If the two lines differ by more than 10%, data will be inaccurate. This can be remedied by cleaning your sensor. Follow these steps to safely clean your PurpleAir.
- Unplug your PurpleAir from the power source.
- Use canned air to gently blow debris, spiderwebs, etc from the electronics
- Lie the sensor on its side and place the nozzle of a vacuum about an inch from the bottom. Leave the vacuum on for about 5 minutes.
- Plug the sensor back in and let run for about 30 minutes. If the two sensors still don’t agree, repeat steps 2 and 3.
- If the sensors still do not agree after 3 iterations, contact the company as you may have a faulty sensor.
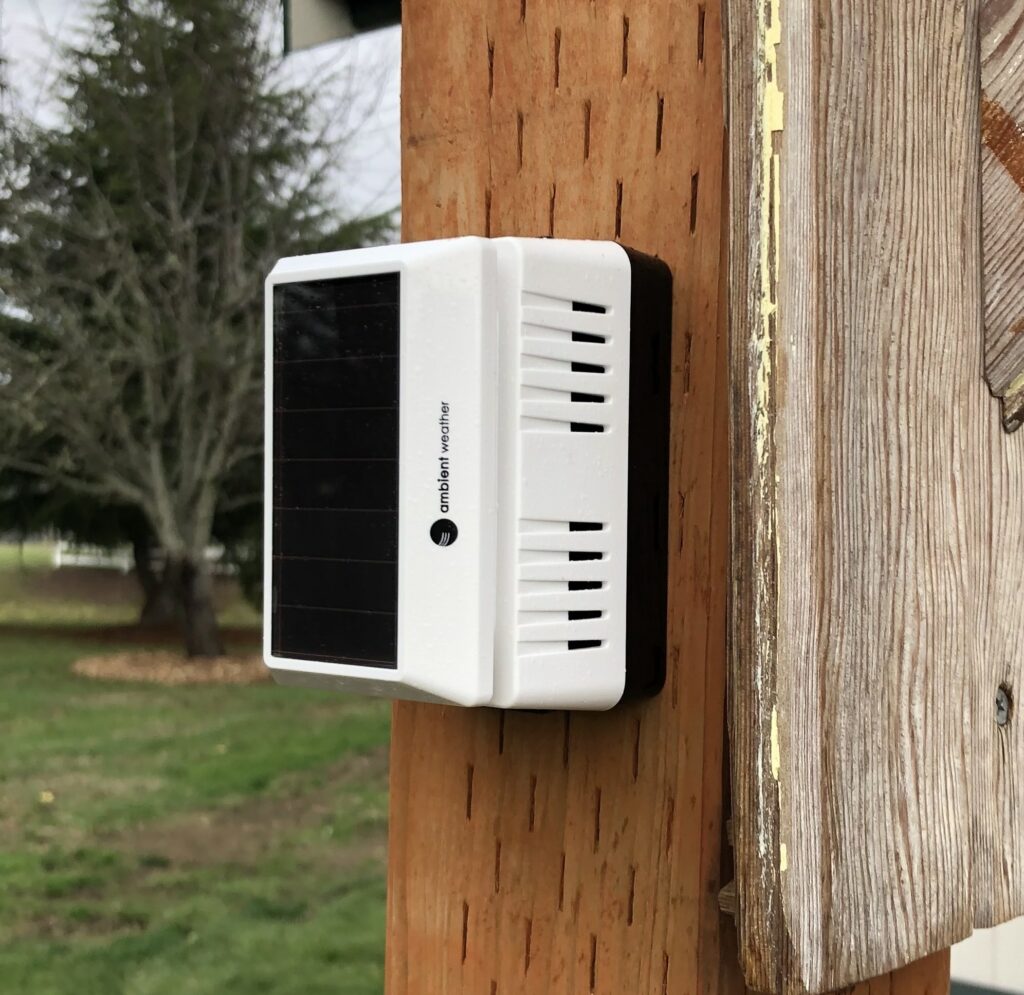
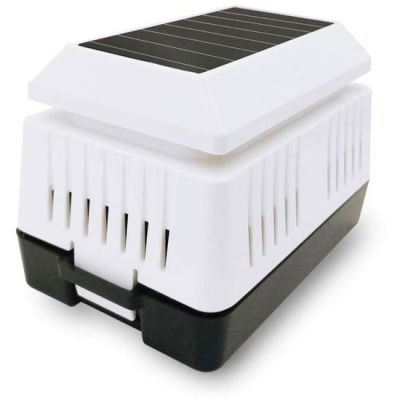
Sensor Notes: Ambient Weather PM
- Requirements: Solar panel for power, with rechargeable battery backup. In long periods of low light, that battery may require additional charging through the USB port.
- Maintenance: self-contained. No maintenance is required after at least 2 years of work
- Data: Transmitted and viewable on the ambientweather.com site
This is a newly available sensor and ORCAA is currently evaluating the data quality.
Note that the Ambient Weather product information pages include the following guidance:
Important Notes and Limitations:
- Place the sensor in a shaded, well-ventilated, non-moisture condensing area. Although the sensor is designed for outdoor use, it is best to mount it in a well-protected area, such as under a patio or carport.
- The solar panel is sensitive to low light and requires monthly charging from the USB power port.
- With PM2.5 sensors, fog reflects the light and can result in a higher reading. This is characteristic of the inherent sensor design. The condition occurs during rainy or foggy weather, where Outdoor Temperature – Dew point Temperature ≤ 2ş C (3.6 şF).
ORCAA’s evaluation confirms that this device is susceptible to giving high readings during periods of fog and high humidity.
Sensor Notes: TSI Bluesky
- Requirements: Power and wifi
- Maintenance: unknown
- Data: transmitted to TSI and viewable on a map, provided you have an account
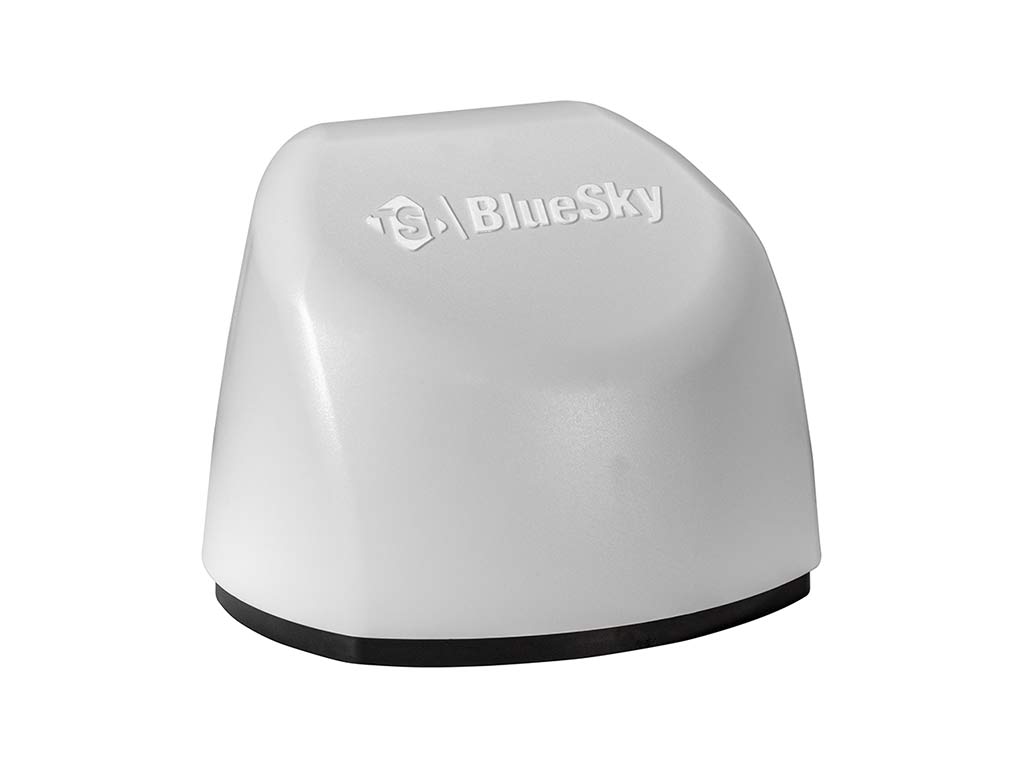
The TSI Bluesky is a newer PM sensor that hasn’t yet gained the popularity seen with PurpleAir. The Department of Ecology has completed a preliminary evaluation of the Bluesky Sensor, sensirion, but has not evaluated the TSI Bluesky unit. View the results from Ecology’s evaluation.
ORCAA does not currently have information on this sensor’s data quality and plans to install one alongside a PurpleAir and our state monitor in Thurston Co soon.
Data from the Bluesky sensor is transmitted to a map hosted by TSI. To access this map, you must sign-up for a free account with TSI.
Sensor Notes: IQAir
- Requirements: wireless connection
- Maintenance: unknown
- Data: data are displayed directly on the unit
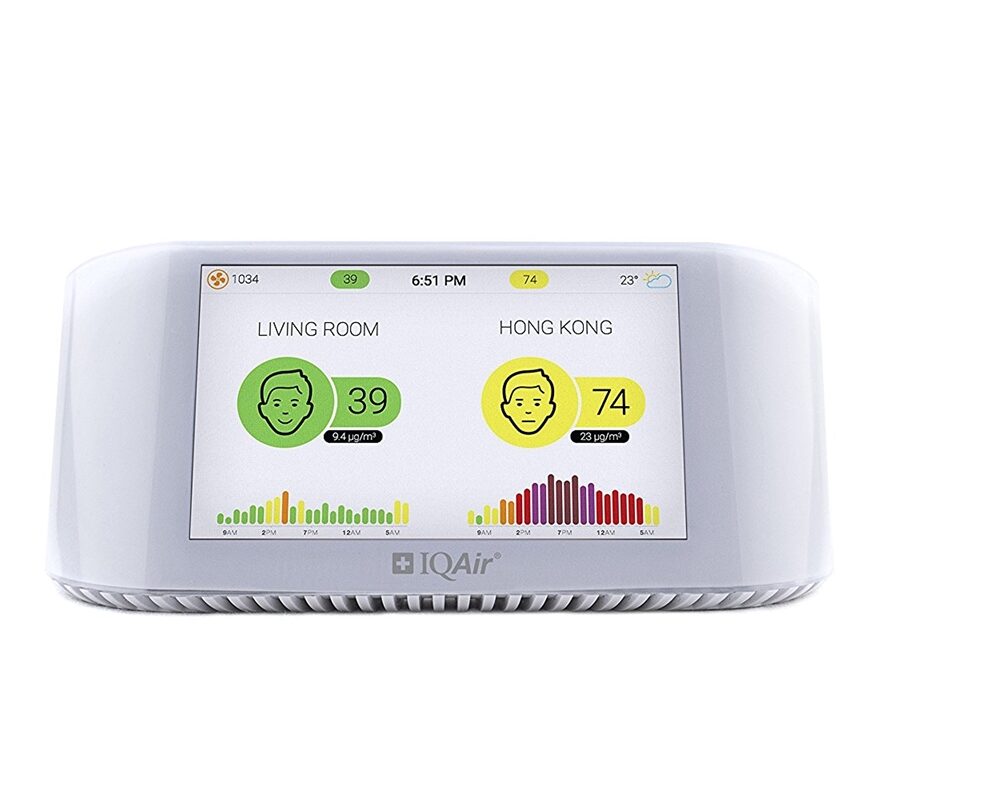
The IQAir sensor is an indoor air quality sensor that incorporates data from nearby government monitors or PurpleAir sensors to provide outdoor air quality. It is battery-operated and can be taken outside for a snapshot of ambient air quality. ORCAA has no information on IQair sensor accuracy or precision.